
Previously, we discussed just how powerful using visuals in your work is. But what is actually included in the term ‘visuals’? In this blog post, we discuss the range of possibilities.
Different kind, different purpose
Visuals can be categorized among their purposes, argue instructional design experts Ruth Colvin Clark and Chopeta Lyons in their book Graphics for Learning. In the book, the authors detail how different kinds of graphics are used in different ways in the learning environment. By using the right graphic at the right time, you will maximize learning, understanding and reasoning, so they argue.
Decorative visuals
The first type of visual that the authors discuss is the decorative kind. The main reason these visuals are used is because of their aesthetic appeal. Next to this, they might serve as a piece of comedic relief or as a motivation to the audience. We should be careful, however, to not overuse decorative visuals: they might become distracting if we cram too many into our work.

Mnemonic Visuals
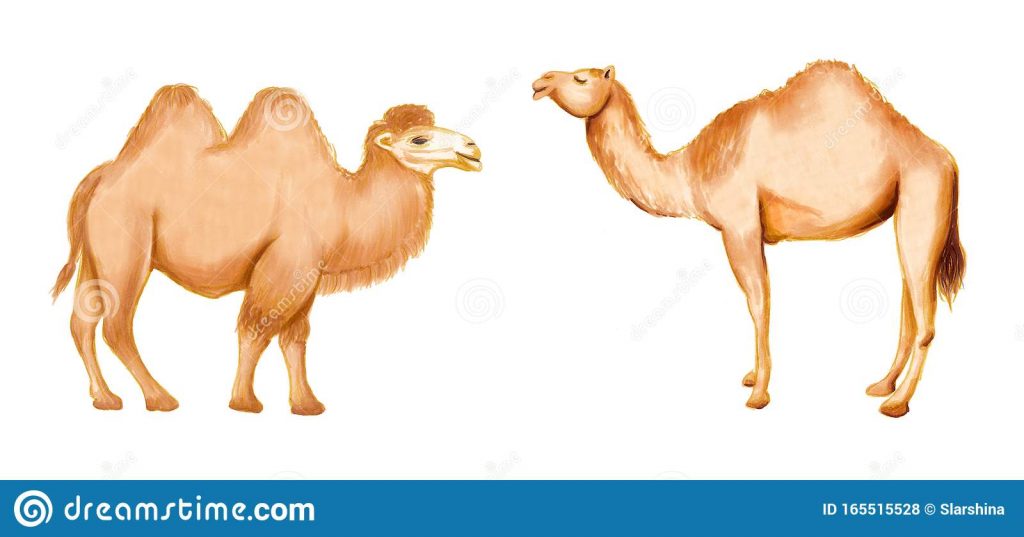
We can also use visuals that serve a purpose. Take mnemonic visuals, for instance. These visuals help people recall details, facts, or concepts. One visual mnemonic is seen below: while the Bactrian Camel’s back is shaped like the letter B, the back of a Dromedary Camel is shaped like the letter D.
Derived from the word Ancient Greek μνημονικός (‘mnēmonikos’), mnemonic means ‘relating to memory’. Although not a ‘real’ mnemonic visual as we’re discussing in this article, the Method of Loci – also known as the memory palace – is also a visual mnemonic. In this technique, we recall information by mentally walking through an environment, such as a palace. Each room is linked to a certain piece of information.
Interpretive Visuals
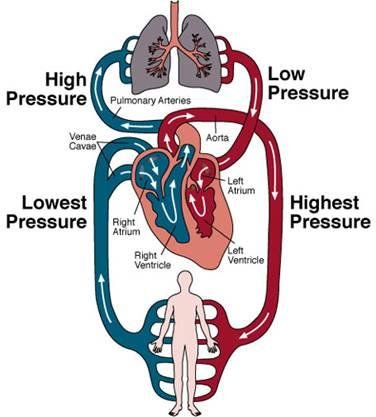
We can also use interpretive visuals in our work. This type of visuals illustrates a principle, theory, or cause-effect relationship. They help the audience to understand a specific process or event which is otherwise too abstract to comprehend. We could use an interpretive visual, for instance, to show different parts of a complex machine.
Representational Visuals
While the previous visuals aren’t necessarily realistic, representational visuals aim to show how something actually looks. In doing so, the audience will become more familiar with a certain topic or product. An example of this is a screenshot of a computer screen in a walkthrough of an installation: by seeing what you are supposed to see, you’re able to progress through the process of installation more easily.
Relational visuals
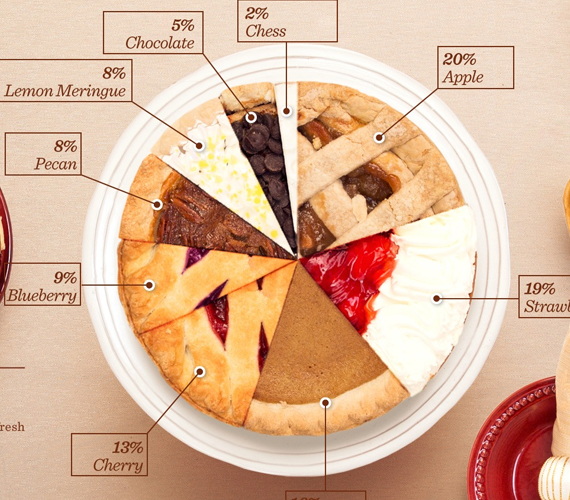
Relational visuals are, you guessed it, used to show quantitative relationships among multiple variables. These relationships are usually visually shown in charts and diagrams: a great example of a relational visual would be a pie chart detailing what share is attributed to different factors. Such visuals would replace otherwise text-heavy content, making your information quicker and easier to interpret.
Organizational visuals
Last but not least, Clark and Lyons demonstrate that organizational visuals are relevant in the learning process. These visuals also show relationships among the content of your work. However, in this case, the relationships are qualitative. These visuals are usually shown as charts, concept maps, or (tree) diagrams, and also reduce the amount of text used in your work. One of the many examples of an organizational visual would be a depiction of how a certain process on the work floor works, such as the development of a product.
The traditional split-up
Of course, visuals can also be divided into more well known categories. If we take a step back from the different visuals from Clark and Lyons, several come to mind. Let’s take a look at their individual differences.
Images and pictures
This is probably top of mind when you think ‘visuals’. Used in many different ways, from clarifications to decorations and instructions, images and pictures serve many purposes. While illustrations can help to explain and represent complex relationships, photographs are great at giving your content a context and add some colour and excitement.
Yes: images and pictures are great. But in our opinion, you should always try to use them in relation to the subject you are working on. When images and pictures only serve decorative purposes, they might become a distraction. This is the case in particular for images that are too generic to be relatable to the content.
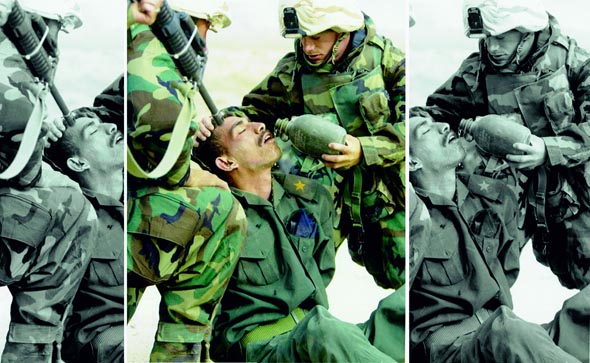
Next to this, misuzing images can lead to manipulation of your audience. So be careful with what you show! By just glimpsing at the image below on the left, we are getting a completely different impression than the image on the right. Instead, the image in the middle shows the truth. Just some cropping work can already change a picture’s meaning within seconds.

Data visualisations
Line graphs, bar charts, pie charts, histograms, we can go on and on. Data visualisations are more important than ever in our fast paced environment. When used correctly, they can make long, boring pieces of texts shorter and more understandable: they take a certain topic and make it clear in just a few lines and numbers.
Overusing data visualisations, on the other hand, is a big risk. Not everything can be or needs to be displayed in a graph – so always think twice about using one. Also consider the time and effort making a clear data visualisation takes. No data visualisation is always better than one that is hard to understand because you didn’t take the audience into consideration well enough.
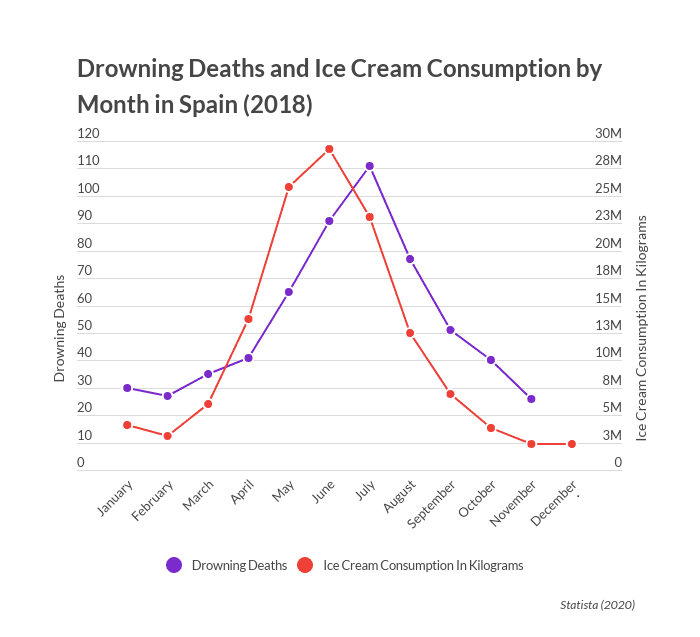
With data visualisations, too, the chance of manipulation is high. Being selective with information included can totally change the meaning of a graph or chart. And: some data is not meant to be put together, because it will lead to wrong conclusions.
The moving kind
In this category, there’s definitely more than just ‘video’! There’s an uncountable amount of different types of videos, such as interviews, animations, vlogs, documentaries and educational videos.
And let’s not forget gifs! Gifs are impactful and fun because of their dynamics. They can also be used in a more serious way: in how-to’s, for instance, where you want to show the steps of a process.
There you have it, the possibilities of visuals are endless. But remember: pay attention to the choices you make, because they will influence how your audience perceives it.
Sources
- https://www.itma.vt.edu/courses/visual/lesson_10.php
- https://www.shiftelearning.com/blog/10-types-of-visual-content-elearning
- https://www.oreilly.com/library/view/graphics-for-learning/9780787969943/#:~:text=Graphics%20for%20Learning%20teaches%20you,learning%2C%20understanding%2C%20and%20reasoning
- https://community.articulate.com/articles/7-ways-to-use-graphics-for-learning


